As a professional in the real estate industry, it is important to understand the correlation between key metrics to make informed decisions when buying or selling a property.
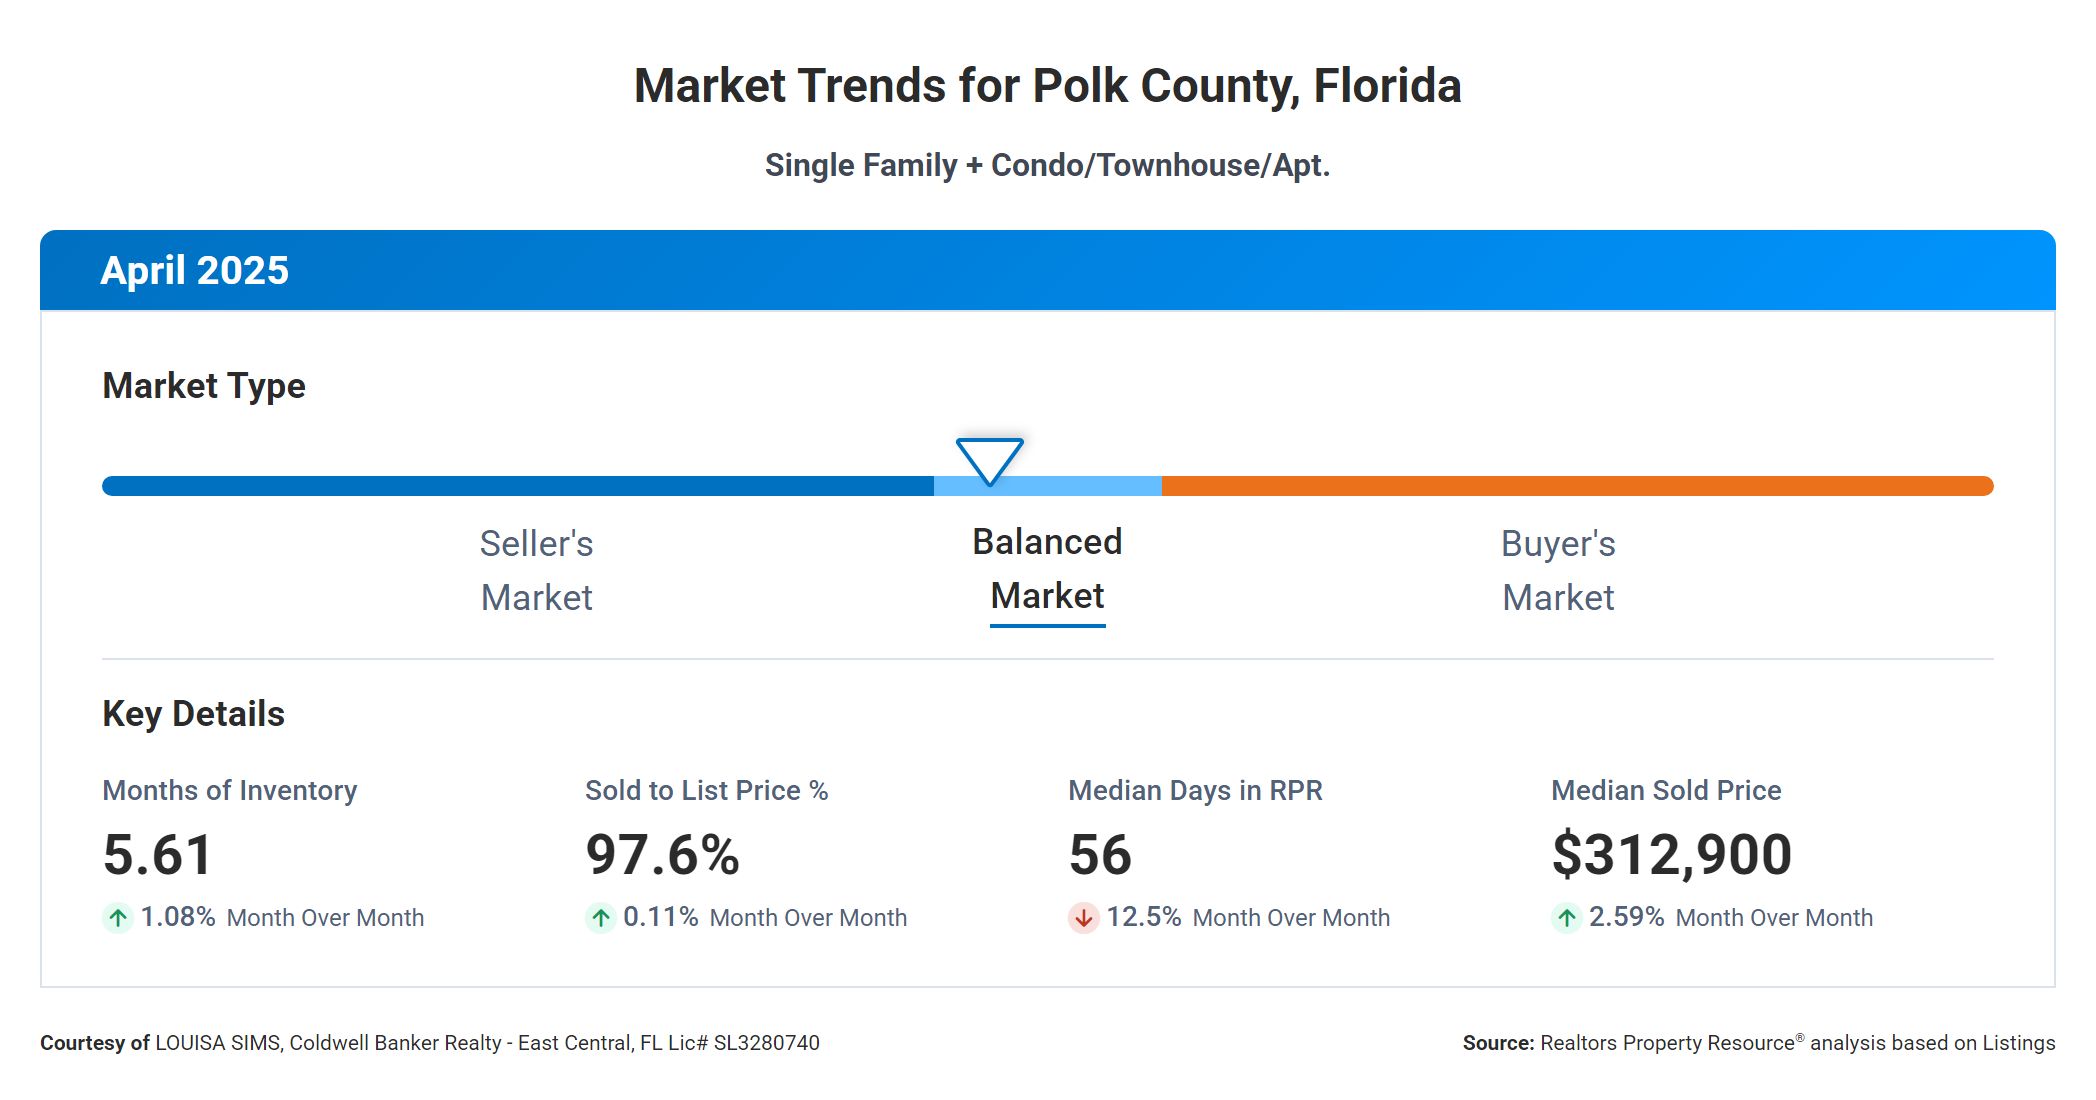
The Months Supply of Inventory, which currently stands at 5.61, indicates the number of months it would take to sell all the homes on the market at the current rate of sales. A lower number typically signifies a seller’s market, while a higher number indicates a buyer’s market.
The 12-Month Change in Months of Inventory has increased by +84.54%, showing a significant shift in market conditions over the past year. This increase suggests that there are more homes available for sale compared to the previous year, potentially leading to more negotiating power for buyers.
The Median Days Homes are On the Market is 56, demonstrating the average amount of time it takes for a home to sell. A lower number may indicate high demand and quick sales, while a higher number could suggest slower market activity.
The Sold to List Price Percentage, which is currently at 97.6%, reveals that homes are typically selling very close to their list price. This percentage can provide insight into the level of competition among buyers and the strength of the market.
Lastly, the Median Sold Price of $312,900 represents the middle point at which homes are selling in the market. This figure can be used as a benchmark for buyers and sellers to understand the current value of properties in the area.
Overall, these metrics are interconnected and provide a comprehensive overview of the real estate market. By analyzing these data points, buyers and sellers can make informed decisions to navigate the market effectively and achieve their real estate goals.


 Facebook
 X
X
 Pinterest
 Copy Link
